No wonder MM Lee
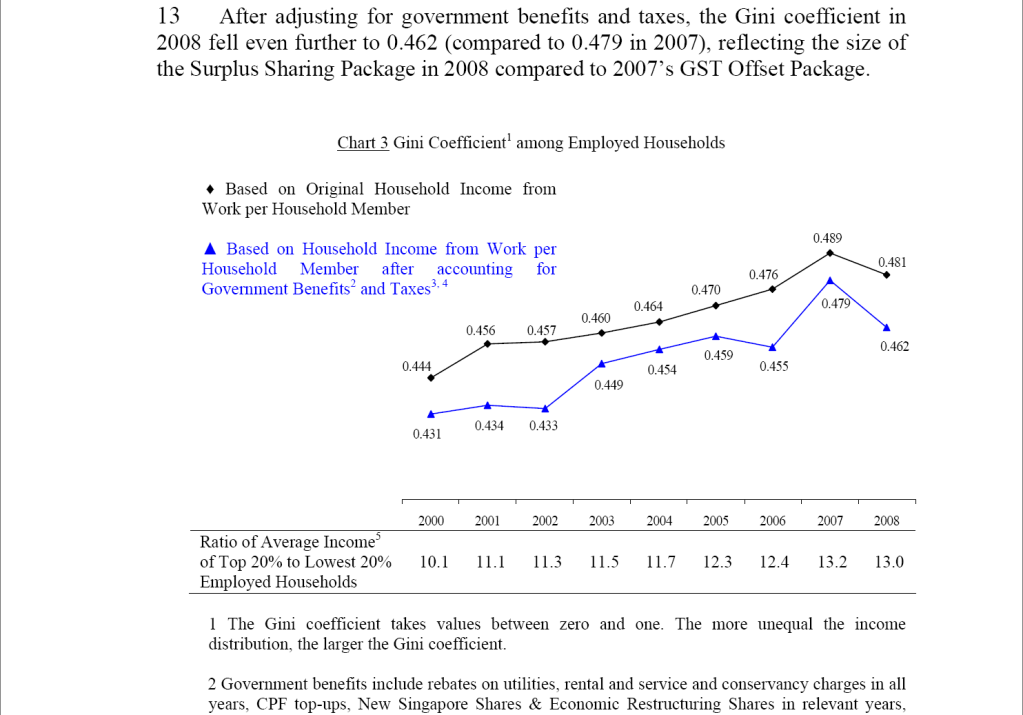
told the NUS undergrads to ignore Gini coefficient readings in a
recent forum. A recent UN study shows that S'pore ranked 2nd
highest in income gap, just behind Hongkong.
http://finance.yahoo.com/banking-budgeting/article/107980/countries-with-the-biggest-gaps-between-rich-and-poor
Countries with the Biggest
Gaps Between Rich and Poor
by Bruce Einhorn, Friday, October 16, 2009
The U.N. Development Program recently came out with a report
looking, among other things, at income inequality worldwide.
The UNDP ranked countries and regions based on a number of factors,
including their Gini coefficient, named for Italian statistician
Corrado Gini.
We have listed the world's most advanced economies based on their
Gini score, with zero marking absolute equality and 100 absolute
inequality. Scandinavian countries, Japan, and the Czech Republic
have the least amount of inequality. The U.S. is among the most
unequal, but it's not No. 1. To see which economy is, read
on.
Top 11 Countries With the Biggest Gaps Between Rich and Poor
No. 1 Hong Kong
Gini score: 43.4
GDP 2007 (US$ billions): 207.2
Share of income or expenditure (%)
Poorest 10%: 2.0
Richest 10%: 34.9
Ratio of income or expenditure, share of top 10% to lowest 10%:
17.8
Renowned for its high concentration of Rolls-Royces, expensive real
estate, and posh shops, the Chinese special administrative region
has plenty of rich who enjoy showing off their wealth. However,
Hong Kong also has one of the largest public housing sectors in the
world, with about half the population living in
government-supported or -subsidized housing estates. The city has
no minimum wage—except for domestic helpers from the Philippines,
Indonesia, and other countries.
No. 2 Singapore
Gini score: 42.5
GDP 2007 (US$ billions): 161.3
Share of income or expenditure (%)
Poorest 10%: 1.9
Richest 10%: 32.8
Ratio of income or expenditure, share of top 10% to lowest 10%:
17.7
Singapore is one of the world's most open economies, and it
suffered badly following the bankruptcy of Lehman Brothers last
year. Recently, though, the city-state's economy has rebounded,
with GDP growing an annualized 14.9% rate in the third quarter
compared with the previous quarter.
No. 3 U.S.
Gini score: 40.8
GDP 2007 (US$ billions): 13,751.4
Share of income or expenditure (%)
Poorest 10%: 1.9
Richest 10%: 29.9
Ratio of income or expenditure, share of top 10% to lowest 10%:
15.9
The share of income for the top percentile of Americans was 23.5%
in 2007, the highest since 1928, according to Emmanuel Saez, a
Berkeley economist who won the prestigious John Bates Clark Medal
in April. Income for the top 0.01% hit a record-high 6.04%. And the
recession may be exacerbating income inequality.
No. 4 Israel
Gini score: 39.2
GDP 2007 (US$ billions): 164.0
Share of income or expenditure (%)
Poorest 10%: 2.1
Richest 10%: 28.8
Ratio of income or expenditure, share of top 10% to lowest 10%:
13.4
Gone are the days when Israel was one of the world's most
egalitarian societies. Early Labor Zionist pioneers built kibbutzim
for Jewish immigrants, but those collectives have fallen on hard
times. The growing number of haredim, or ultra-Orthodox Jews, with
large families and men who study the Torah rather than work has
worsened the inequality problem.
No. 5 Portugal
Gini score: 38.5
GDP 2007 (US$ billions): 222.8
Share of income or expenditure (%)
Poorest 10%: 2.0
Richest 10%: 29.8
Ratio of income or expenditure, share of top 10% to lowest 10%:
15.0
While Portugal emerged from recession in the second quarter, the
unemployment rate tops 9%. The ruling Socialists retained power in
elections last month but lost seats to parties on the far
left.
No. 6 New Zealand
Gini score: 36.2
GDP 2007 (US$ billions): 135.7
Share of income or expenditure (%)
Poorest 10%: 2.2
Richest 10%: 27.8
Ratio of income or expenditure, share of top 10% to lowest 10%:
12.5
According to the OECD, New Zealand had the biggest rise in
inequality among member nations in the two decades starting in the
mid-1980s. The country's economy emerged from recession in the
second quarter, but with growth of just 0.1%, the central bank is
likely to keep interest rates low until well into 2010.
No. 7 (tie) Italy
Gini score: 36.0
GDP 2007 (US$ billions): 2,101.6
Share of income or expenditure (%)
Poorest 10%: 2.3
Richest 10%: 26.8
Ratio of income or expenditure, share of top 10% to lowest 10%:
11.6
Italians are focused now on the melodrama surrounding embattled
Prime Minister Silvio Berlusconi. The political crisis comes at a
time when the economy is still mired in recession even as countries
like Germany and France are growing again.
No. 7 (tie) Britain
Gini score: 36.0
GDP 2007 (US$ billions): 2,772.0
Share of income or expenditure (%)
Poorest 10%: 2.1
Richest 10%: 28.5
Ratio of income or expenditure, share of top 10% to lowest 10%:
13.8
According to Britain's Institute of Fiscal Studies, a
government-funded think tank, the average national income, adjusted
for inflation, grew 0.5% between 2004 and 2008. In contrast, the
same figure for the top 90% income bracket jumped 1.2% over the
same period. That was predominantly driven by large salaries and
bonuses from the financial services sector in the pre-credit crunch
era.
No. 9 Australia
Gini score: 35.2
GDP 2007 (US$ billions): 821.0
Share of income or expenditure (%)
Poorest 10%: 2.0
Richest 10%: 25.4
Ratio of income or expenditure, share of top 10% to lowest 10%:
12.5
While developed economies elsewhere fell into recession, the Lucky
Country's good fortune held out, with Australia continuing to grow
thanks in part to strong demand from China for its resources. This
month the central bank raised interest rates, making Australia a
leader among countries moving away from monetary easing.
No. 10 (tie) Ireland
Gini score: 34.3
GDP 2007 (US$ billions): 259.0
Share of income or expenditure (%)
Poorest 10%: 2.9
Richest 10%: 27.2
Ratio of income or expenditure, share of top 10% to lowest 10%:
9.4
Put aside the old comparisons to Asia's tiger economies. Ireland's
workers are suffering badly from the recession; the unemployment
rate soared in August to 12.5%. That's the second-worst in the EU,
behind only Spain.
No. 10 (tie) Greece
Gini score: 34.3
GDP 2007 (US$ billions): 313.4
Share of income or expenditure (%)
Poorest 10%: 2.5
Richest 10%: 26.0
Ratio of income or expenditure, share of top 10% to lowest 10%:
10.2
Newly elected Prime Minister George Papandreou's government faces
potential disciplinary action from the European Union, which has
reprimanded Greece for a budget deficit of 6% of GDP, twice the EU
limit. The IMF projects the economy will shrink 0.8% this
year.