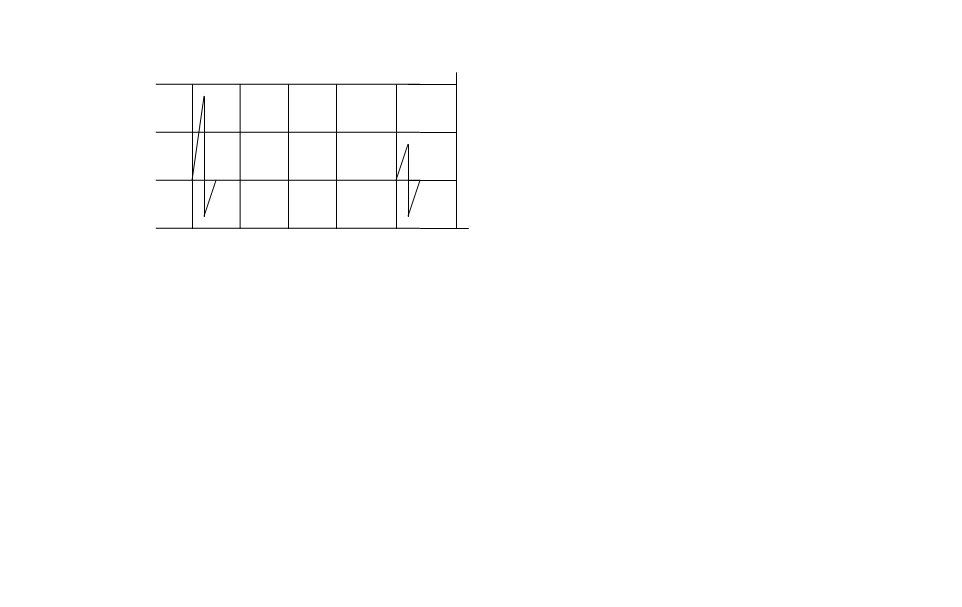
I find myself having difficulties interpreting C.R.O graphs and
drawing it out. Our teacher didn't really teach us that. So yea,
hope you guys can clarify some of my doubts.
Here's one question from my assessment book:
With the Y-plates switched off the time base is set to
2ms cm-1. Draw the horizontal line in the screen below if the
frequency of the time-base is 50 Hz.
Period : 1/50 = 0.02
0.02/0.002 = 10
Does the 10 units refer to the number of lines counted
individually to the left and right or is it like 5 units to left
and units to the right(with respect to the dot in the
middle)?
And 1 square represents 1 cm. I do not get why my answer draws
the line on 2.5 lines to the left and right individually and say it
is 10cm. Someone, please help.
2. If the X-plates are switched off and Y-plates are
connected to a 240 V A.C source ad the Y-plates are set to a scale
of 60 V/cm,
Do we draw something like 4cm to the top(with respect to spot in
the middle) and 4cm to the bottom? I do think this is correct, but
again, my book draws it about 4.5 - 5 units to the top and
bottom.
This is a topic that uses a lot of pictures and drawing and
sketching.
I need to see your answer and the assessment book's answer. I
have a hunch why you are confused, but without seeing the picture,
I cannot confirm. And the explanation will and might be
confusing.