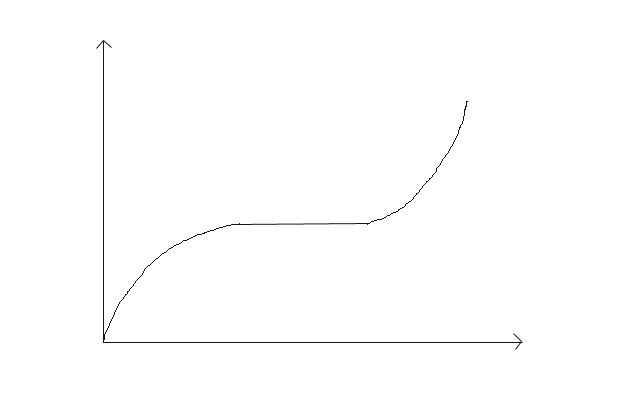
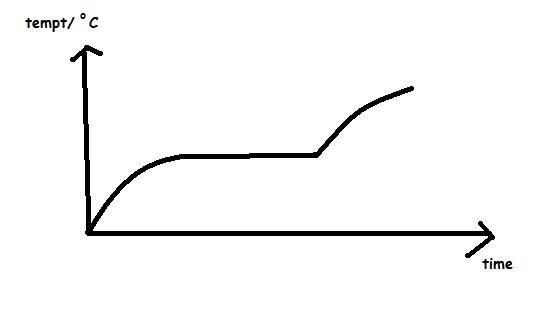
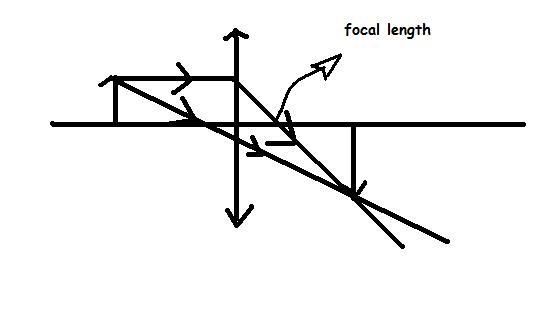
this is how my graph looks like...
Honestly, that looks weird. I don't know if it's
correct but there's definitely something weird about it.
I think the curve from -2 to 1 should be at the 1 to 4 part, and
vice versa.
By the way, the question was to draw a graph for the ice
pack, not for the solid that melts at 1 degree celsius.
Therefore, even if all the curvatures are right, you were drawing
the graph for the wrong object.