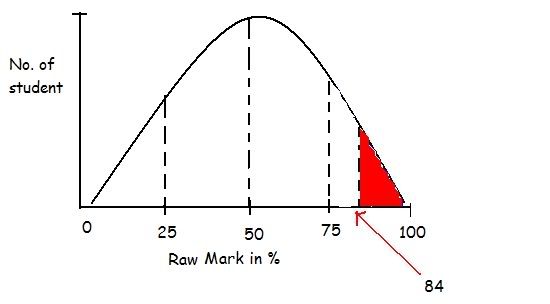
SEAB will try to fit your grades into normal distribution
curve.
If a lot of people do very well, the curve will be heavily skewed
to the right with mean > 80% and low standard deviation, then
the expected A1 grade will be more than 90%.
For example,
Assuming the paper is very easy.
Mean of the score is 85%, Standard deviation = 2
Assuming that SEAB allocates 10% of cohort to get A1, The A1
cut-off point will be 87.5%.
Assuming SEAB allocates another 5% of cohort to get A2, The A2
grade will be 87%
Assuming SEAB allocates the next 15% of cohort to get B3, the grade
will be 86%
Assuming SEAB allocates the next 10% of cohort to get B4, the grade
will be 85.5%
Assuming SEAB allocates the next 20% of cohort to get C, the grade
will be 84.5%
Assuming SEAB allocates the next 40 % of cohort to get grade D and
below, the grade will be
So fail grade is < 84.5%
From the above illustration, only 5% difference will cause you to
fail.
So, you must do very well when the paper is very easy. Careless
mistake will cause you a B grade.
The normal distribution curve above is very 'normal', i.e. that
graph is constructed under the assumption that the paper is
relatively hard that mean is 50%